Tuesday evening 31st May 2016, Peter Switzer had Gary on to discuss current Market conditions and his correct prediction for ‘Hold and Stay’ in May.


Tuesday evening 31st May 2016, Peter Switzer had Gary on to discuss current Market conditions and his correct prediction for ‘Hold and Stay’ in May.
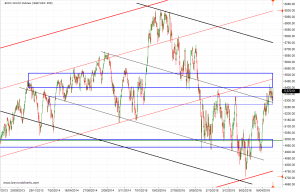
The ASX200 has continued a steady rise over the last month making May of 2016 a “hold and stay” rather than a “sell and go away”. The daily chart below of the ASX200 shows the steady advance from around 4910 in mid-April and right through May. The ASX200 has risen from below to above: the…
Thursday evening 5th May 2016, Peter Switzer had Gary on to discuss current Market conditions and whether or not to ‘Sell in May and go away’.
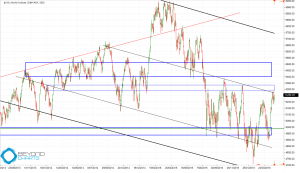
Whilst the chart of the ASX200 shows that a technical resistance zone has been reached there may be more good news that stalks behind the scenes and that belies the current poor economic news of a waning China that fills the airwaves. But first to the chart of the ASX200. In January and March I…
Monday evening 21st March 2016, Peter Switzer had Gary on to discuss current Market conditions.
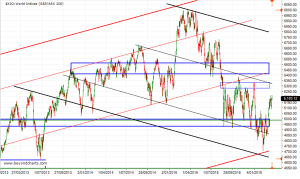
The first chart below of the ASX200 index uses two charting techniques, support and resistance zones and long term trend lines that form channels. The channel demarcated with red trend lines is an upward trending channel and the channel demarcated with black lines is a downward trending channel at an inverted gradient of the up…
It is two months since I last analysed the ASX benchmark indices for the Switzer Super Report when I asked the question, “will the ASX’s significant support zone hold?” At this stage, using a subjective ‘rule’ that I have observed over the last twenty years or so, I can report that the ASX’s significant support…
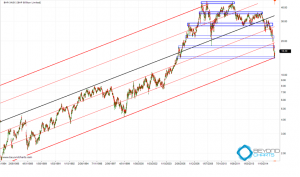
The 32 year logarithmic chart below shows the channel in which BHP’s share price has moved over this period. The black median trend line shows the controlling gradient. The two outer bold red trend lines are the upper and lower channel lines and the thinner red lines are support and resistance trend lines reached along…
How worried should we be about the current market madness?
Tuesday evening 2nd February 2016, Gary Stone took Switzer TV viewers through the current Market conditions discussing the current Secular Bull Market, and Primary Bear Market.
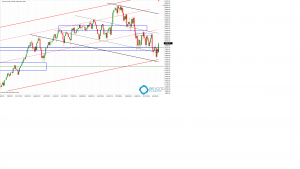
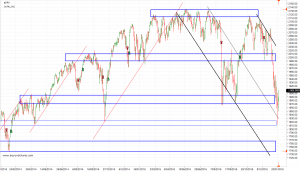
This two year chart of the S&P500 shows a down trending channel demarcated with black trend lines. The middle thinner black line is the median line of the channel where the S&P500 found support in the middle of last week. The gradient of the down trending channel is an inversion of the up-trend red lines….